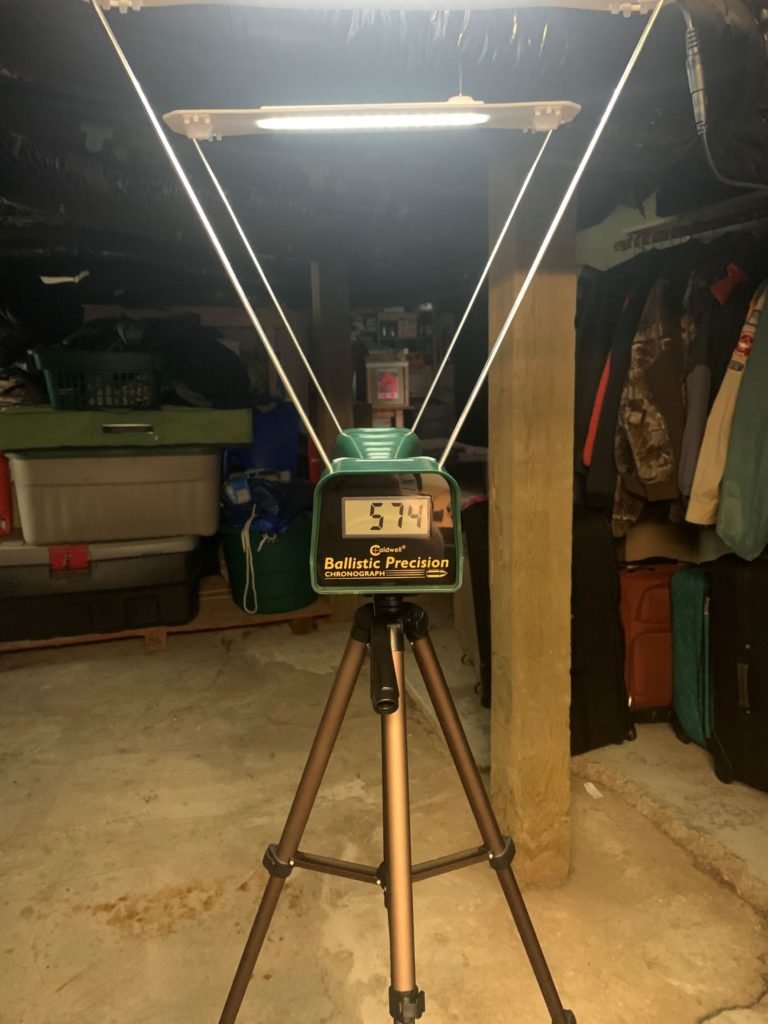
During the holiday weekend, I finally got some time to mess around with my chronograph. My initial test was not very favorable. I wasn’t able to get any readings the first time I messed with it (before vacation). But, I spent some time last Saturday to try and figure out what was wrong.

Today, I am going to talk about math again. I know, I know it is less fun than watching paint dry. I want to talk about looking at the dataset, calculating average with standard deviation and energy as a result of my velocity measurements. Should be fun.
A quick aside about math. We use math to describe physical behavior. I am not just solving problems for problem sake, like sudoku. I am looking at the data so that I can compare certain behaviors like 1) how consistent is the rifle 2) is a lighter faster pellet better than a heavier and slower pellet (when I look at the energy)? 3) Does pellet shape make a difference with the same weight?
Maybe it is the cold medicine talking but I came up with this idea this morning. Art and math are very similar. Both are attempting to describe life in different ways. One is by representation and the other is by description. One is subjective by interpretation and the other is deterministic, using concrete laws and methods. What I am trying to say is that you don’t have to know how to do math (like art) to appreciate what it does for us. Unlike art, I can show you how I got to my final numbers.
I went about this in a pseudo scientific way. I shot a bunch of times and recorded the data that I liked the best. In all seriousness, I need to spend more time with this device to understand what a good reading looks like. However, I had a lot of readings that were similar and some that were way off the reservation. I threw out those measurements as outliers. In science, those would have qualified reasons to be excluded. There are mathematical ways of proving those outliers, but that is super advanced math. That being said, I am just going to ignore them as bad measurements.


Here is the dataset I ended up with (feet per second or fps). I think you can see why excluded the results in the images above.
- 942
- 946
- 966
- 959
- 953
- 952
- 973
- 947
- 951
- 966
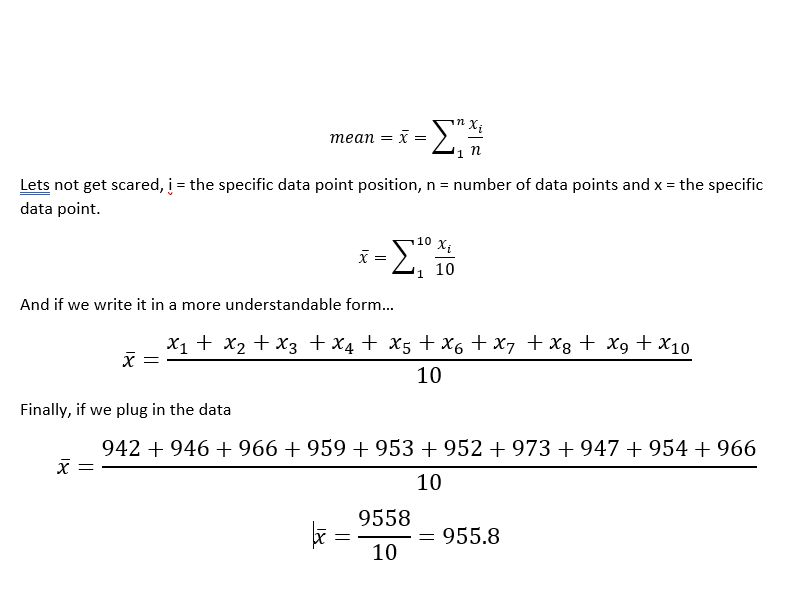
The first thing that we need to calculate is the mean. Another word for that is average.

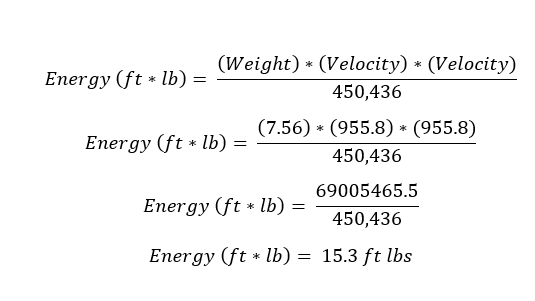
What I have calculated is the average pellet velocity is 955.8 fps. We will need that number to calculate the standard deviation. It looks reasonable so far but I think that I will save that calculation for next week. Before I end, I will plug the average velocity into the energy calculation because that is the number I am looking for to compare everything in the future.

End Your Programming Routine: If I assume that the outlier measurements were problems measuring and not exactly irregularities firing the rifle, I am pretty impressed with the consistency of the velocities. I did ignore values that did not change after firing. Again, I don’t know if the velocities were the same, but I assume that the pellet did not measure. Give me some time with this device and I can have more confidence in the actual results.
Recent Comments